How Dark Sky Works
Posted on by Adam GrossmanDark Sky is a weather prediction and visualization app for the iPhone, iPad and iPod touch. For an overview, and to learn how you can help us, check out our Kickstarter page.
A lot of people have been wondering how Dark Sky works. In this post I’ll try to shed some light on what goes on under the hood.
Getting the data
All our radar data comes from the National Oceanic and Atmospheric Administration. NOAA operates a network of over 140 radar stations spread across the United States and its territories, and one of the advantages of being a US citizen is that you get access to this data for free. They’re mandated by law to make their information public, but they go above and beyond by providing real-time access via the web and FTP.
We download the raw radar data in binary format. But if you’re looking to get started playing around with weather radar, a better place to start is perhaps RIDGE, which boils the raw data into color-coded images that are easier to work with.
Cleaning it up
Weather radar is noisy. There’s lots of ground clutter, bug and bird migrations (!), and other artifacts that can be confused for precipitation. Here’s an example:
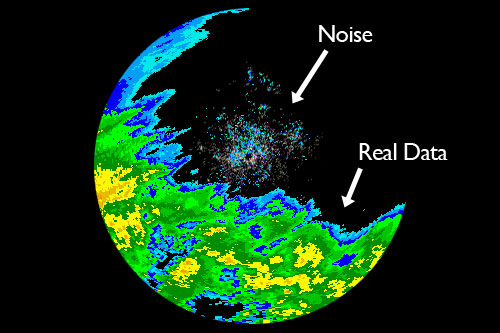
So we’ll need to clean this up. How do we do it? Well, the noise mostly consists of low-intensity data -- the light blue areas. One technique (which this gentleman writes more about), is to simply remove all low-intensity data. It clears away the noise, and leaves most of the actual precipitation data.
However, for our purposes, “most” isn’t good enough. By removing low-intensity data indiscriminately, we’re removing valuable data from the leading and trailing edges of the storms. This data is crucially important if we’re going to predict when it will start and stop raining. So we’ll have to be a little more clever.
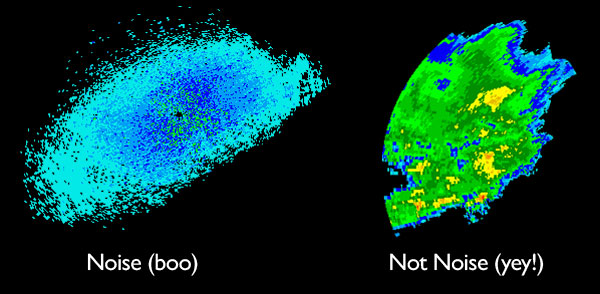
After staring at enough radar images, it becomes pretty clear which signals are real precipitation data, and which are noise. Not only does noise tend to be low-intensity, but it has a recognizable “texture” which is distinct from actual storms. It’s easy to see with the eyes, but hard to explicitly quantify or define. So how do we write a program to remove it? This type of I-know-it-when-I-see-it, but ill-defined situation is ripe for some machine learnin’.
In this case, we opted for neural nets. Using the Fast Artificial Neural Network C-library, we trained a neural net with thousands of “blobs” of data hand-separated into two categories: noise, and not-noise.
The training process takes a while to run but the end result is a small, blazing fast program that accurately identifies somewhere between 90% and 95% of the noise, with very few false positives.
(To take care of the remainder, we spent an embarrassingly large amount of time and effort writing heuristic clean-up code by a tedious process of trial and error. But we’re keeping that part secret ;-)
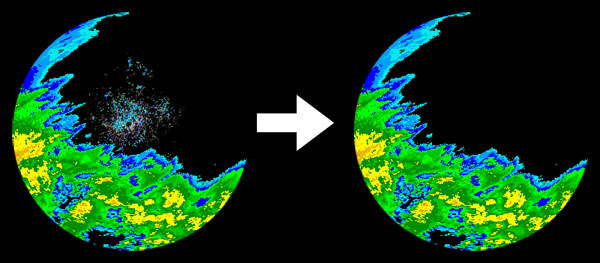
The end result looks something like this:
Extracting storm velocity
Now that we have the radar data and we’ve cleaned it up, we come to the real meat of the app: velocity extraction.
But first, let me talk a little about the philosophy of our approach...
Weather is chaotic. It’s the quintessential non-linear dynamical system. Complicated fluid dynamics combined with a spinning globe, uneven terrain, and energy pumped into the system from the sun makes the weather extremely hard to predict with any accuracy. Meteorologists have spent a century coming up with increasingly sophisticated models and they still can’t reliably talk about the weather -- even generally -- much more than a week in advance.
So how can we justify our claim of being able to predict precipitation down to the very minute?
Well, here’s the thing: while the weather becomes chaotic and unpredictable at large timescales (hours to days), its behavior becomes increasingly linear at smaller and smaller timescales. To see this in action, take a look at cumulus clouds drifting across the sky. They tend to move in relatively straight lines:
We’ve found that precipitation bands are even more coherent and behave approximately linearly over the course of minutes, and in many cases up to an hour or more. So how do we go about quantifying this linear motion? Math, that’s how!
We use various computer vision algorithms to compare multiple radar image frames and create a map of velocity. Specifically, we use OpenCV, an open-source computer vision library, which comes with a number of optical flow and object tracking algorithms (for a great introduction to the topic and to see some sample code, check out this tutorial by David Stavens at the Stanford AI Labs).
The end result looks something like this:
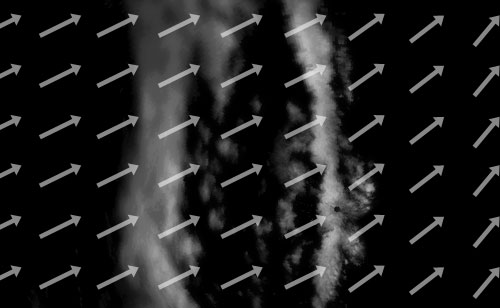
Actually, we don’t draw little arrows. Instead, we encode the velocity in a more useful form: colors. We create a 3-channel image where the red channel represents velocity in the x-direction, the blue channel represents velocity in the y-direction, and the green channel represents change in storm intensity:

(If you’re so inclined, open the image in Photoshop and check out the color channels individually)
Prediction and Interpolation
So, now that we’ve extracted storm velocity, it’s time to use it to predict the future!
The reason we encode velocity data as an image is so we can pass it off to the GPU on the iPhone and iPad. Both the storm prediction and the smooth animations are calculated on the device itself, rather than the server, and all the magic happens directly on the GPU.
I’m going to be a little vague here, since this part constitutes our “secret sauce”, and is the component of our system that is in most active development. So instead, here’s a pretty video of the app in action:
Monitoring error
A prediction is worthless unless it is not only accurate, but reliably accurate. A large amount of our effort is focused on measuring the error rate of Dark Sky predictions. Some storms are more coherent and stable than others, so how far into the future we can project varies over time and at different geographical locations.
Whenever we process a new radar image, we go back to previous images and project them forward, creating a map of what we think the storm will look like in the present. We then compare this with the latest radar image to see how close we got.
We are constantly doing this check in real time, for every radar station. This lets us monitor our accuracy, and helps us quantify how effective future improvements are.
In conclusion...
So Dark Sky consists of a number of different moving parts that all need to fit together to create accurate predictions and pretty animations. This post glosses over many of the details, but I hope it helps get across the essential process and our approach to short-term weather forecasting.
It’s very much a numerical & statistical approach, rather than a meteorological one. Since we’ve launched the Kickstarter project, we’ve had several people (many of them meteorologists) criticize it because it eschews physical modeling of atmospheric fluid dynamics. And it’s true that our system will never be able to predict six hours in the future, let alone a day from now. But by focusing on the immediate future, and leaving everything beyond to the meteorologists, we can create a highly accurate app that is useful in a surprisingly wide range of applications.
So if you are excited by this as much as we are, please help us out by backing our Kickstarter project. Every dollar counts!
http://www.kickstarter.com/projects/jackadam/dark-sky-hyperlocal-weather-prediction-and-visuali